
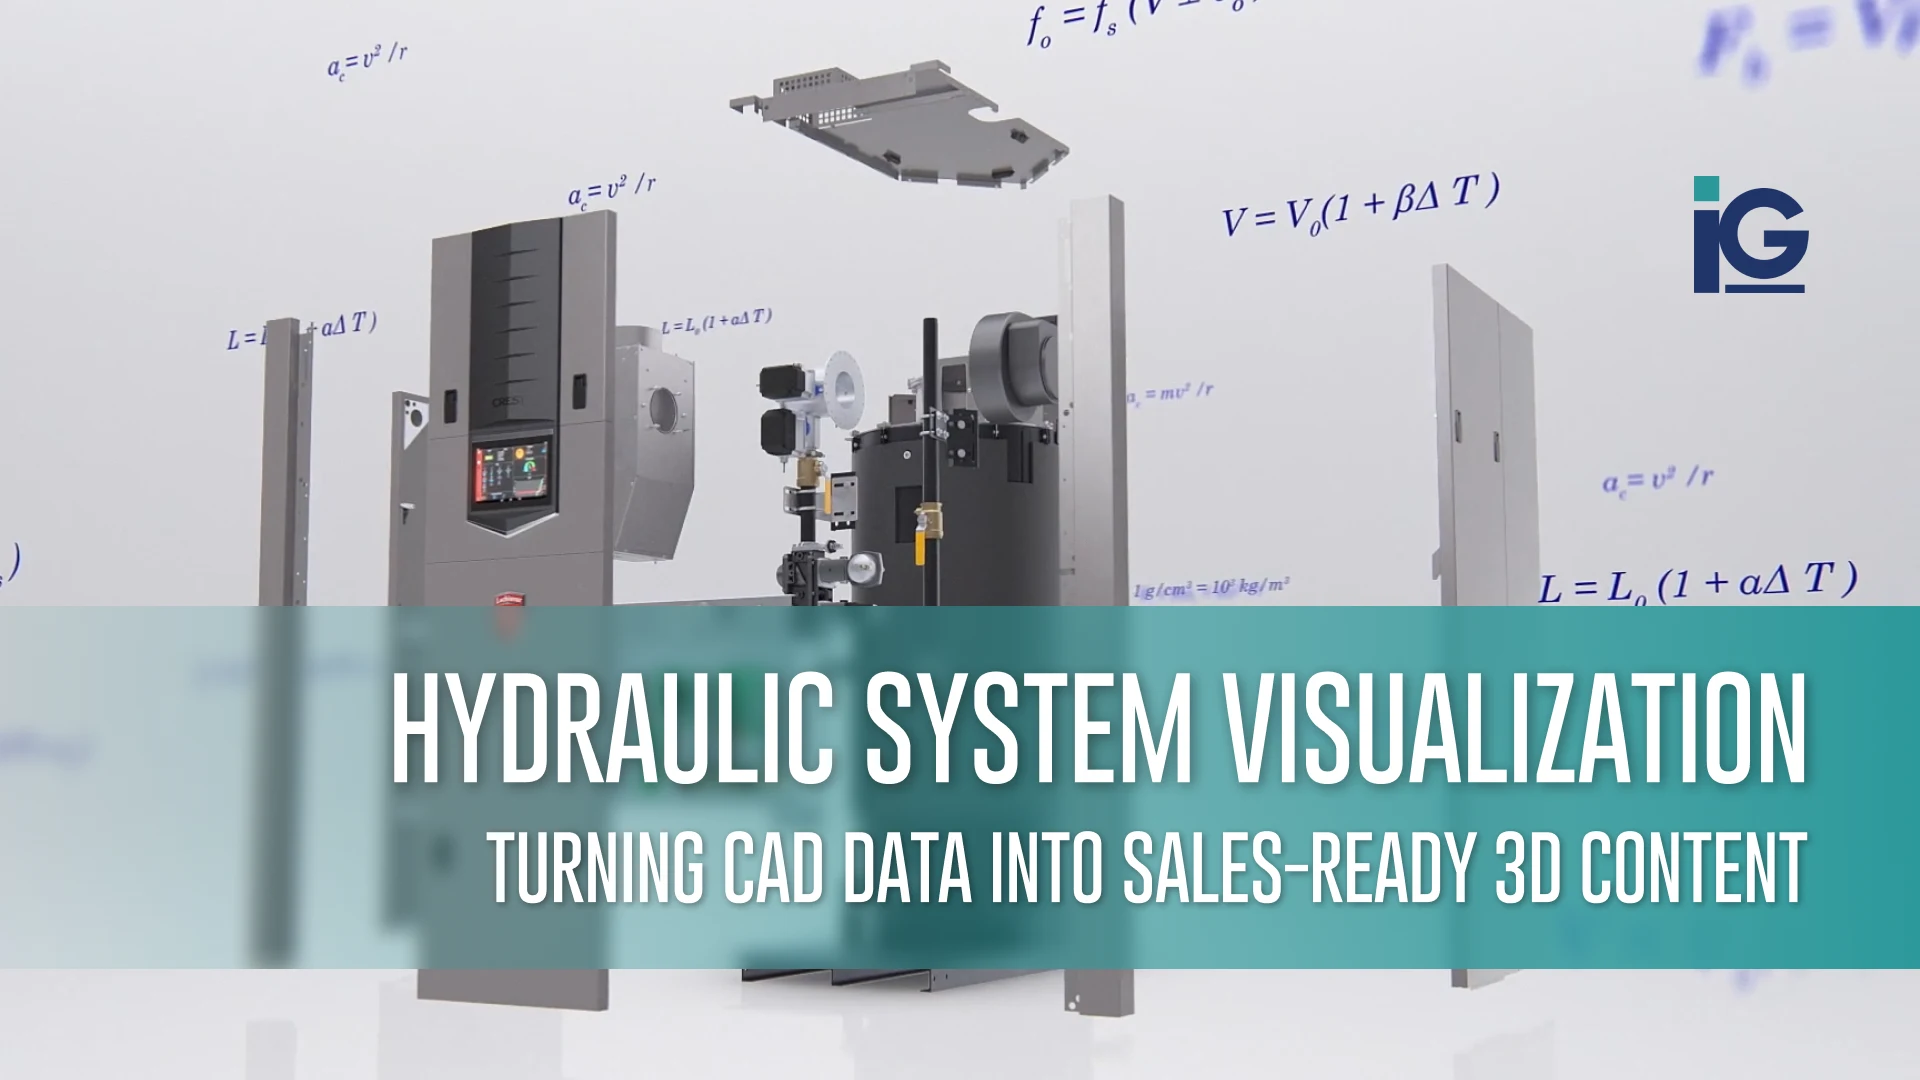
Selling a hydraulic system with just a spec sheet can be challenging. The document can tell an engineer its flow rate, pressure ratings, and cycle times, but it does not necessarily show a buyer why it’s better. Neither does it help a distributor explain what the system does on a sales call.
Hydraulic systems are some of the hardest products to sell. Unlike many mechanical products, their most important functions happen where no camera can reach. It’s inside sealed components, under pressure, and in constant motion. You can’t photograph fluid flow, pressure changes, or the way individual components work together during operation.
That’s the gap we constantly solve at Info-Graphics. By turning existing CAD data into 3D visuals, animations, and interactive content, complex hydraulic systems are easier to understand, explain, and sell. Manufacturers get products to market faster and walk into sales conversations with more confidence. It gives distributors a way to showcase products without visiting the factory, while helping customers see exactly what they’re buying before making a decision. This approach is part of a broader shift toward 3D visualization in industrial marketing.
In this guide, we’ll show how hydraulic system visualization and hydraulic product animation help turn technical products into sales-ready content that buyers can quickly understand.
What is Hydraulic System Visualization?
Hydraulic system visualization is the process of turning existing CAD and engineering data into visual content that explains how a hydraulic system works. Using 3D renders, hydraulic system animation, and interactive experiences, manufacturers can show fluid flow, pressure, component movement, and system operation in ways that photos and spec sheets cannot. The goal isn’t to replace engineering documentation but to make it easier for customers, distributors, and sales teams to understand.
Why Spec Sheets Are Not Enough for Hydraulics
Hydraulic systems are difficult to explain because their biggest advantages aren’t visible at first glance. A spec sheet can list numbers, but it falls short in showing what they mean in actual performance.
There are a few reasons for that:
Performance is a state, not a shape
A pump or valve looks the same whether it’s operating at 10% capacity or 100%. There’s nothing to point at.
All the action happens inside
Fluid flow, pressure changes, and component movement all happen out of sight, making them difficult to explain with photos alone.
Quoting is technical and time-pressured
A distributor or sales engineer often needs to explain system behavior to a buyer during a quoting conversation, not after a formal demo has been scheduled.
Configuration changes the story
Different manifolds, valves, actuators, and layouts mean one product image rarely represents every variation a customer might buy.
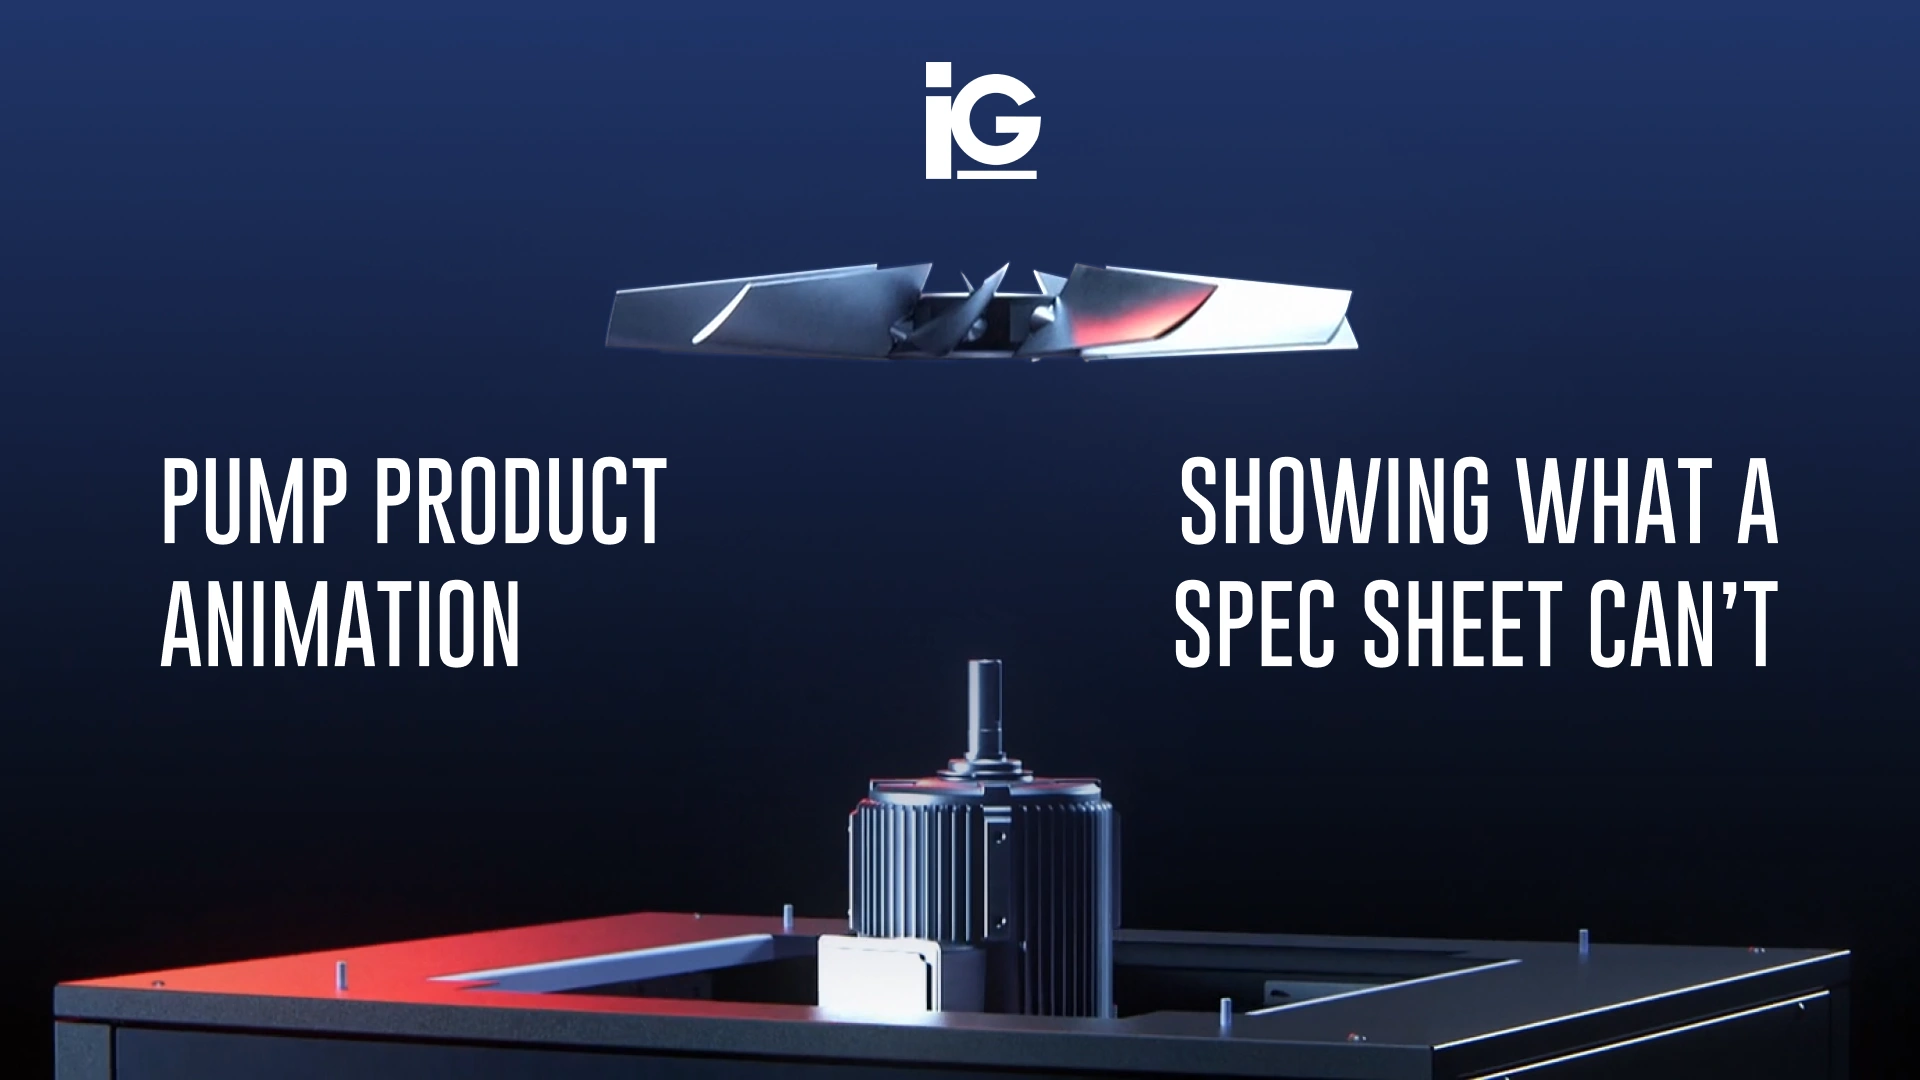
In cases like these, product photography isn’t always the answer. Sometimes, the most effective way to explain a hydraulic system is to show it in action, through technical product animation built from the CAD your team already has.
What Sales-ready Visualization Looks Like for Hydraulics
Creating sales-ready visualization doesn’t mean producing flashy marketing videos with Hollywood budgets. It’s about giving sales and distribution teams a tool that answers a buyer’s question without a follow-up call or a scheduled demo.
For hydraulic systems, that usually comes down to three problems this kind of content is built to solve:
1. Help Buyers Understand Performance They Can’t See
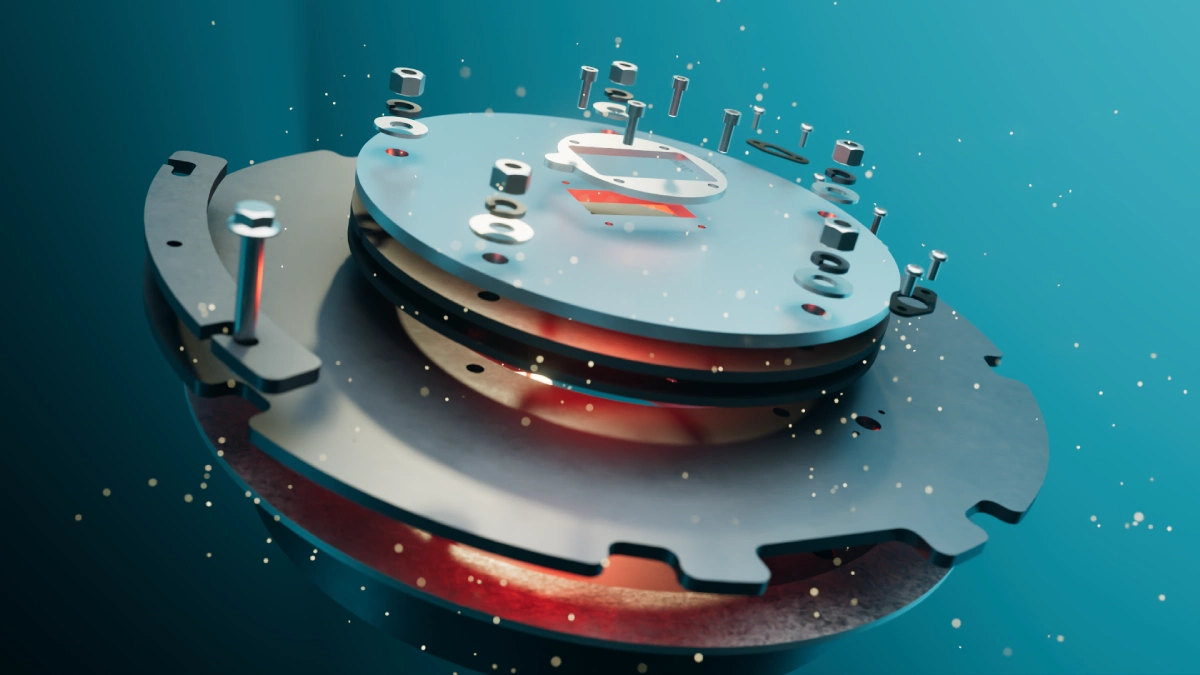
Instead of describing fluid flow, pressure changes, or valve sequencing in words, motion, color, and transparency show what’s happening inside the system as it operates. Sales teams get the closest thing to a live demo they can carry into a meeting without waiting for a test bench or cutaway unit.
We took a similar approach with Lochinvar’s FTXL fire-tube boiler. It allowed Lochinvar to showcase the unit’s mechanism and design without needing to explain it line by line. Existing technical engineering data was transformed into an animation that clearly showed the unit’s internal operation. Rather than relying on static diagrams or lengthy explanations, the visualization made complex processes easier for customers, dealers, and sales teams to understand at a glance. The result was a more effective marketing and sales asset that helped communicate the product’s value long before anyone saw the equipment in person.
For more on how animation style affects clarity, see our guide to motion graphics styles for product storytelling.
2. Support Every Configuration Without New Photography
Most hydraulic product lines aren’t one-size-fits-all. As valve blocks, manifolds, or actuators change, the same CAD model can be updated without starting from scratch or scheduling another photoshoot. This matters most for manufacturers with wide product families, where a single static asset can’t realistically represent every SKU a distributor might quote.
This is the same principle behind photorealistic product catalog renders: one base model, adapted across configurations instead of rebuilt for each one.
3. Help Sales Answer Technical Questions Faster
A lot of technical sales stall out when a buyer asks a specific question mid-conversation and the sales rep either has to promise a follow-up call or fumble through a spec sheet. Short renders, cutaways, or animations are built to answer those questions on the spot. It allows reps to show a specific pressure response, a valve sequence, or a component the buyer asked about directly.
This does not necessarily equate to a polished explainer video for a homepage, but more like a visual your reps can pull up on a laptop or tablet while a deal is still being discussed. The goal is to make technical claims much easier to understand and visualize.
Where is CAD-Based Product Visualization Used?
CAD-based product visualization supports much more than sales. The same CAD-driven visuals typically get reused across:
- Product launches
- Trade shows
- Distributor education
- Customer onboarding
- Technical training
- Service documentation
- Interactive product experiences
Want to see how this plays out on real projects? Head over to Info-Graphics case studies or explore the services behind each of these use cases.
Why It Must Start With CAD but Isn’t Entirely About CAD
CAD data is the foundation for every render, animation, and interactive tool built by Info-Graphics. That part of the process does not change for hydraulic systems. Every project starts with the engineering file your team already has. The same file becomes an entire library of marketing, sales, training, and support content — not a single one-off asset. But for hydraulics, it isn’t only about the starting point; it’s about what the content needs to prove once it’s built.
For many industrial products, that’s relatively straightforward. Buyers want to see what the product looks like, how it fits together, or how it’s installed. CAD-based visualization and engineering visualization make those things easy to communicate.
Hydraulic systems are different.
The conversation rarely starts with, “What does it look like?” It starts with, “Why is this system better?” Buyers want to understand how fluid moves through the system, how components perform under pressure, and what makes one design more efficient or reliable than another. Those answers aren’t visible from the outside, and a static render of the housing won’t tell the story.
That’s why effective hydraulic system visualization goes beyond creating an accurate 3D model. It uses CAD as the starting point to reveal the performance, movement, and engineering decisions that make the system worth choosing in the first place.
We’ve Done This Before (For Hydraulics and More!)
Turning complex products into sales-ready visuals isn’t new territory for Info-Graphics. It’s a challenge we’ve solved for more than 30 years across manufacturing, HVAC, medical devices, energy, industrial equipment, and other complex machinery where technical specifications alone aren’t enough to tell the full story.
Manufacturers bring us the CAD data their engineering team already has, and we turn it into visuals that answer the questions buyers are actually asking. Instead of expecting customers to interpret specifications on their own, they get to see how a product works, what makes it different, and why it’s the right choice.
The same approach works for hydraulic systems. Info-Graphics is NOT a general animation studio that occasionally takes on technical projects. We’re a creative and technical team that understands engineering workflows and knows how to turn CAD data into content that supports sales, marketing, and customer education. The goal isn’t just to deliver visuals but to work as an extension of your marketing and engineering teams.
What that’s meant in practice for clients:
● Accelerated launch timelines
● Reduced product photography costs
● Improved visual consistency across product lines
● Marketing and sales content ready before physical prototypes existed
When your product’s biggest advantages happen inside the system, words and static images can only go so far. CAD-driven visuals make complex performance easier to understand and sell.
Every hydraulic system has a story that spec sheets can’t fully tell. If you’re ready to turn your CAD data into visuals that help customers understand and buy with confidence, we’d love to learn more about your project.
See how your engineering files can become a complete library of sales, marketing, and training assets. Let’s discuss how to turn your CAD into content that shortens sales cycles and improves customer understanding.
Frequently Asked Questions (FAQ)
1. Do I need a working hydraulic unit before visualization can start?
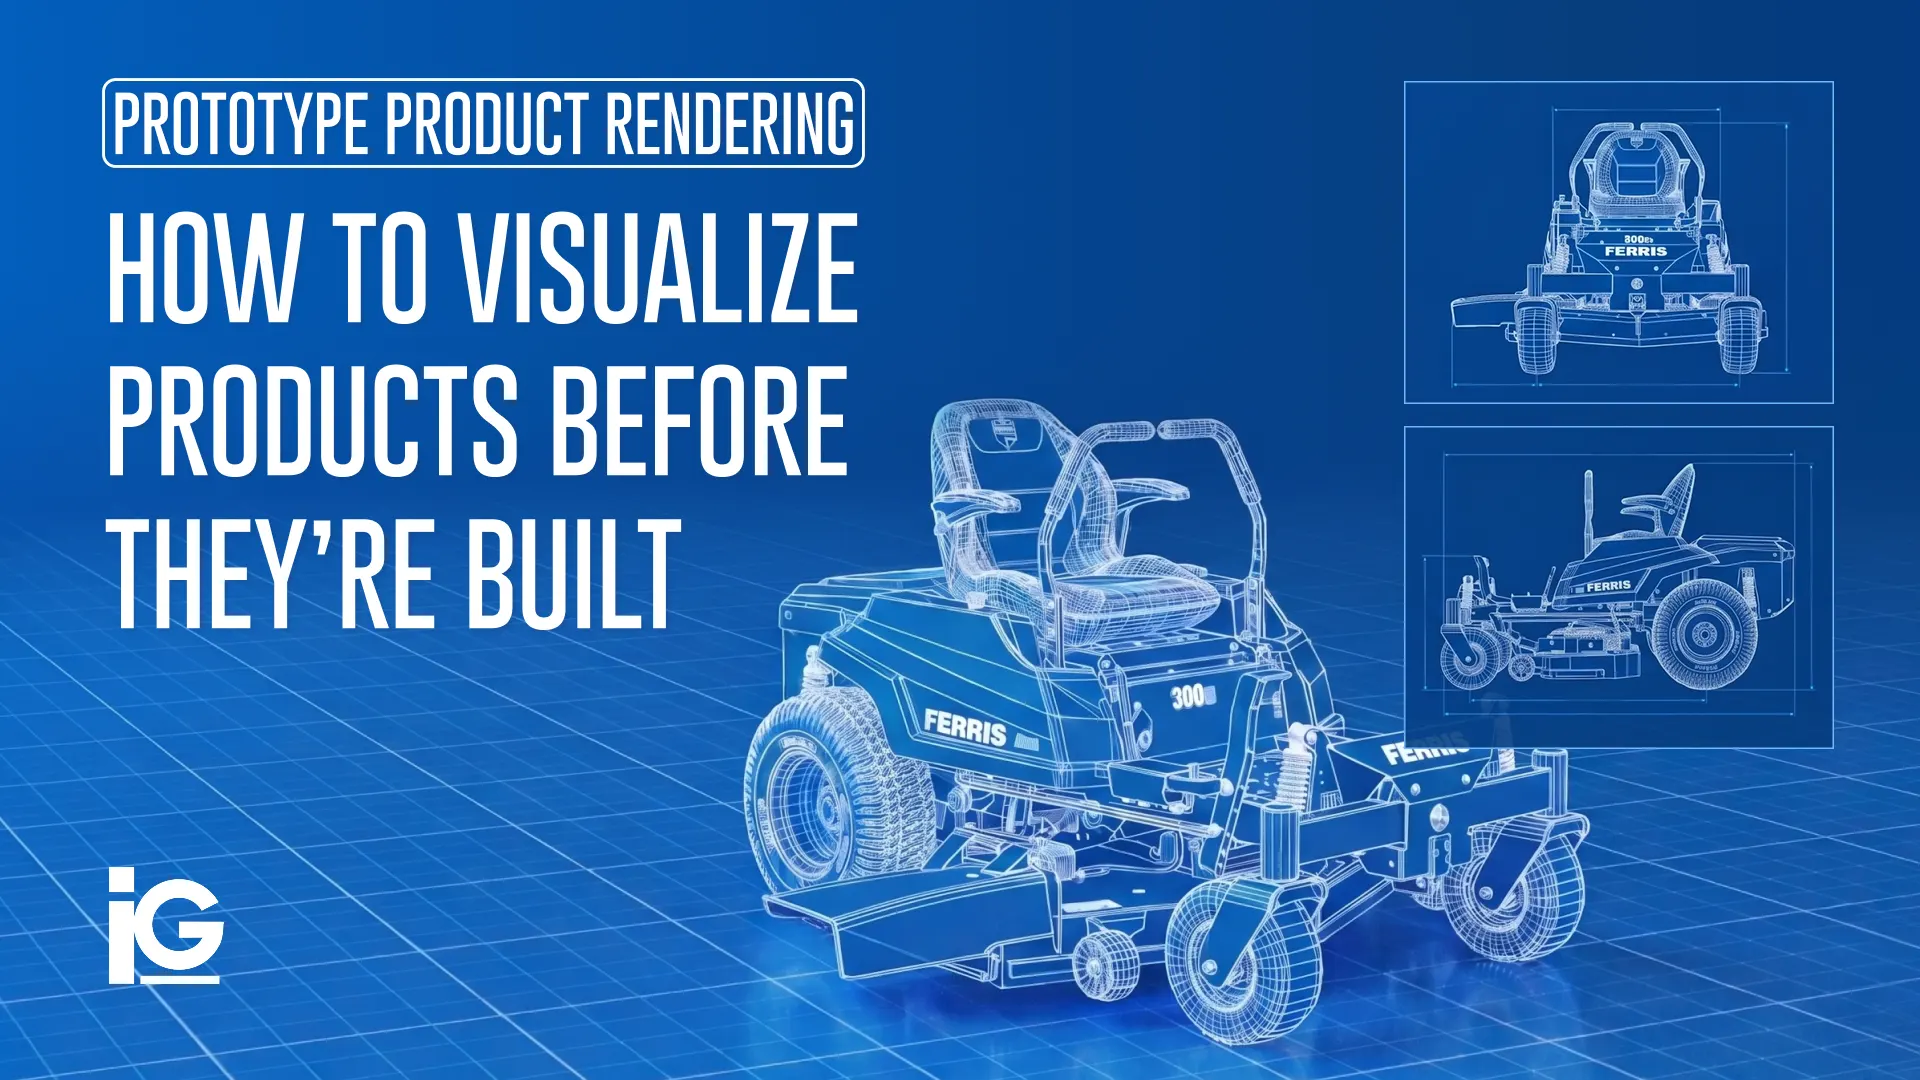
No. Hydraulic system visualization is created from existing CAD and engineering data, so it can begin before a physical prototype is built. This allows manufacturers to prepare sales, marketing, and product launch materials before the first unit is produced.
2. Can the same visualization be reused across different product configurations?
Yes, a base CAD model can be re-rendered or re-animated as valve blocks, actuators, or manifolds change. This makes it easier to create visuals for multiple product variants without starting from scratch or scheduling a new photoshoot with every variant.
3. Is hydraulic system visualization the same as a training or installation video?
No. A hydraulic system visualization is designed to explain how a hydraulic system works and why it offers value to potential buyers. Training and installation videos focus on operating, maintaining, or servicing equipment after purchase. Both can use the same CAD data, but they serve different purposes.
4. How is hydraulic system visualization different from general 3D product animation?
A standard 3D product animation often focuses on a product’s appearance, assembly, or installation. Hydraulic system visualization goes further by showing internal fluid flow, pressure changes, component movement, and system operation. This helps customers understand the performance and engineering behind the product, not just what it looks like.
5. What are the benefits of hydraulic system visualization?
Hydraulic system visualization helps manufacturers explain complex products more clearly, support sales conversations, reduce reliance on physical prototypes, and create marketing content from existing CAD data. It also helps customers understand how a hydraulic system works before making a purchasing decision.





Leave A Comment