
The holiday season is the Olympics of marketing: fast, competitive, and unforgiving to brands that can’t communicate clearly. Audiences scroll quicker, inboxes pile up, and every business fights for a few seconds of attention. Visual content becomes the anchor that cuts through the noise — but the real question isn’t whether you should use visuals. It’s about which visuals will deliver the impact you need.
That’s where the debate comes in: infographic vs motion graphics for business campaigns. Both formats work. Both tell stories well. But during the holidays, the choice becomes strategic. Picking the right visual can elevate your message; choosing the wrong one can bury it under the season’s content overload.
Let’s make that decision easier.
What Infographics and Motion Graphics Bring to Holiday Campaigns
Info-graphics: Quick, Clear, and Shareable
Infographics break down complex information into something fast and easy to understand. This efficiency is crucial because 65% of buyers are visual learners, making visuals the most effective way to convey information about your services or products.
This power is rooted in the Picture Superiority Effect, a theory by psychologist Allan Paivio. Paivio believed this effect occurs because any visual (like an infographic) is encoded by the brain both as an image and as a word, making it highly memorable. In fact, audiences remember 80% of what they see and do, compared to just 20% of what they read.
This blend of psychological efficiency and visual clarity makes infographics perfect for quickly delivering information during the holiday rush, such as:
- Gift guides
- Year-in-Review summaries
- Holiday promo breakdowns
- Social carousels
- Email-friendly snapshots
They’re bite-sized, skimmable, and highly shareable — perfect for audiences multitasking their way through the season.
Motion Graphics: Dynamic, Emotional, and Engagement
Motion graphics provide a more dynamic way to present information by adding movement and clarity to charts, icons, and product elements. This helps viewers understand complex ideas more quickly. Data suggests that about 70% of marketing professionals say motion and video content drive more conversions than any other type, and 88% of consumers report that animated visuals make them more likely to buy.
Motion graphics work exceptionally well for:
- Holiday ads
- Animated greetings
- Promo countdowns
- Product teasers
- Short reels and stories
They consistently capture attention and create stronger engagement
Infographic vs Motion Graphics for Business: What Actually Matters this Season
1. Engagement Speed
Infographics deliver fast clarity and superior retention. These highly shareable and digestible images can make presentations 43% more persuasive while boosting website visits and reach. When rapid education and visual comprehension are the goals, infographics are the most efficient visual tool.
In contrast, motion graphics offer a dynamic alternative to traditional still data visualization, adding depth and context to the data. By animating charts, graphs, and other visual elements, motion graphics allow viewers to grasp complex relationships and trends more intuitively. This makes them ideal for B2B storytelling and high-impact promotions. The directive is simple: use infographics for persuasive education, and motion graphics for high-impact promotions and inspiration.
2. Production Speed
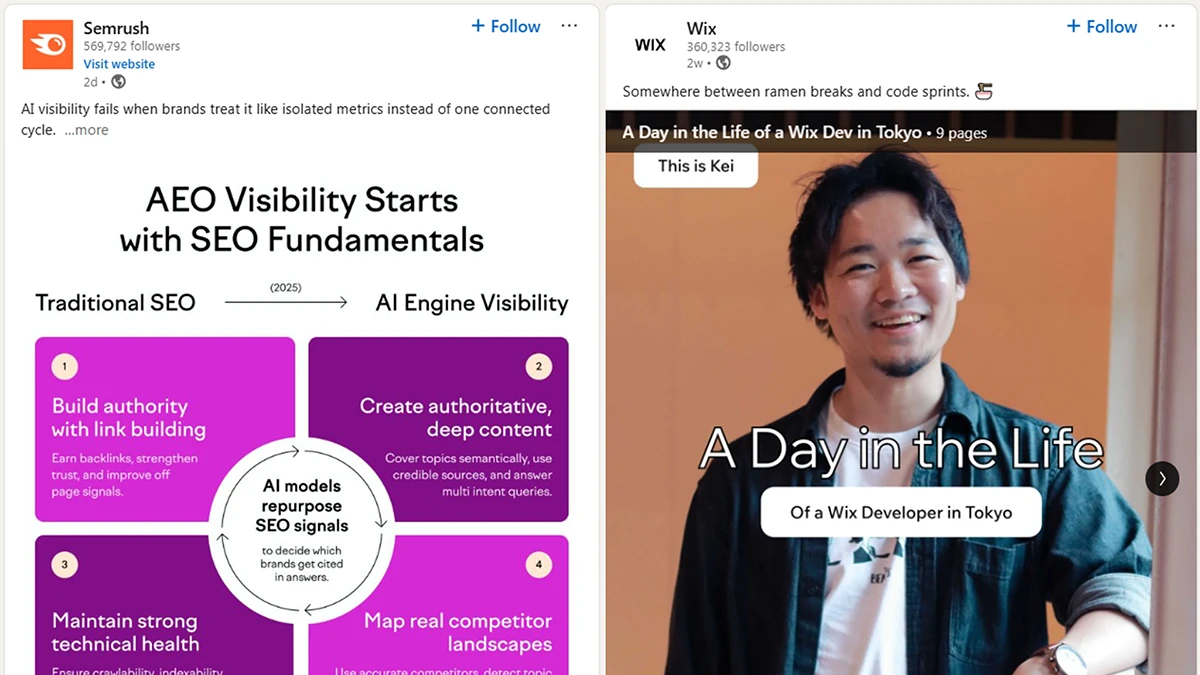
Most essential marketing content—from upcoming product launches to testimonial carousels—still relies heavily on static images, such as infographics. Brands like Semrush and Wix actively use these formats to quickly relay data, tips, or platform updates because static posts are fast and easy to produce, which is crucial for managing extensive content campaigns.
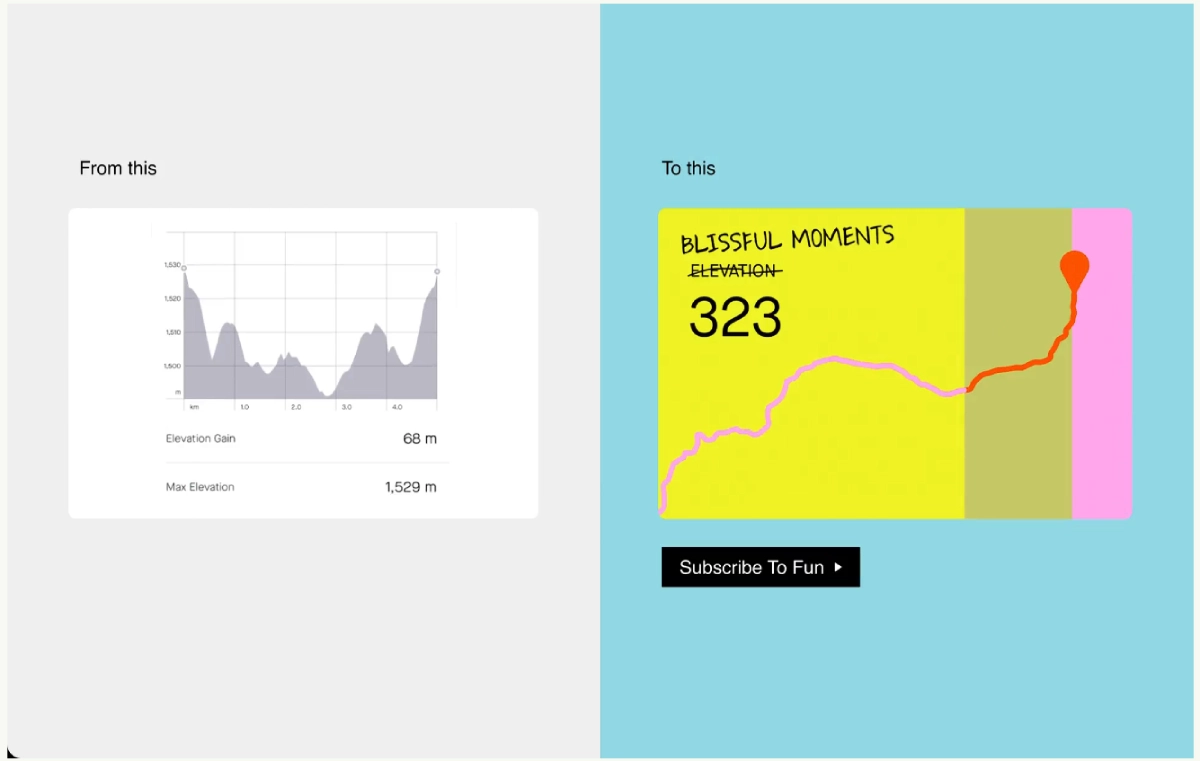
In contrast, motion graphics demand a greater investment of time, particularly in developing specific animated visuals and defining movement. For example, the complex creative collaboration between Superside and Strava resulted in numerous high-impact assets deployed over a rigorous six-week period.
However, this increased investment pay offs in performance. The collaboration demonstrates how static, dry data is transformed into interactive and engaging motion graphics. This transition is now essential because audience behavior is changing.
Gone are the days when brands could rely solely on one format. The rise of video-first platforms like TikTok, Threads, and Instagram has forced companies to embrace creative, short videos. This trend is visible across the spectrum:
- Consumer giants like Ikea and Zara use dynamic video to drive trends.
- Even key B2B platforms, such as LinkedIn, now prioritize video content for higher engagement and visibility.
To stay competitive, brands must leverage both formats, using motion to cut through the noise and static content for reliable, efficient data distribution.
3. Cost and Resources
While both static infographics and motion graphics are effective methods for conveying information, they require vastly different investments in time, skills, and budget.
Infographics are generally more affordable because they require standard graphic design skills, fewer specialized tools, and faster production cycles. This makes them ideal for maintaining high content volume and managing limited budgets.
Motion graphics, however, demand a higher investment due to their complexity. They require specialized skills in animation, kinetic typography, and timing, often involving tools like Adobe After Effects or Cinema 4D.
4. Platform Performance
Matching the format to your audience’s holiday behavior is critical.
Infographics excel on authoritative, data-driven platforms like LinkedIn and corporate blogs. Their effectiveness is rooted in visual communication: 40% of people respond better to an image than 1,000 words, making them highly persuasive for professional communication. In contrast, motion graphics are essential for high-velocity, high-engagement channels like Instagram, TikTok, YouTube, and paid ads. These platforms are optimized for the dynamic content B2C leaders like Chipotle and Duolingo use to capture attention. Even LinkedIn now prioritizes video for higher engagement.
The directive is to match the format to your objective: if your message requires clarity and long-term authority, use infographics; if it needs immediate, maximum dynamism, use motion graphics.
A Simple Holiday Framework
Matching goals and constraints to the correct visual format
Now that you understand the key differences in cost, speed, and platform performance, how do you decide where to invest your holiday resources? The selection must be strategic, not arbitrary. Use this simple five-point framework to match your campaign goals and constraints quickly:
What’s your goal?
- Educate/Summarize: Choose Infographics
- Inspire/Promote/Convert: Choose Motion Graphics
What’s your timeline?
- Tight/Fast Turnaround: Choose Infographics
- Flexible/High Investment: Choose Motion Graphics
Where will this live?
- Email, LinkedIn, Blogs: Choose Infographics
- Social Feeds, Paid Ads, Landing Pages: Choose Motion Graphics
What’s your message type?
- Data-heavy/Process-driven: Choose Infographics
- Emotion-heavy/Narrative: Choose Motion Graphics
What’s your budget?
- Limited/Volume Focus: Choose Infographics
- Premium Campaign: Choose Motion Graphics
The Hybrid Campaign Advantage
The most effective campaigns leverage a hybrid approach, ensuring consistency while maximizing reach across channels:
- Infographics: for email, reports, or long-form posts
- Motion Graphics: For social media and animated greetings
- Static Snippets: For LinkedIn and short-loop retargeting.
This multi-format strategy keeps your holiday messaging consistent while adapting to the unique engagement style of each platform.
Holiday Creative Best Practices
Infographics (Clarity Focused)
- Keep layouts clean and scannable.
- Use subtle holiday accents.
- Focus the design on one core idea.
- Always include a clear CTA.
Motion Graphics (Impact Focused)
- Hook viewers in the first two seconds.
- Keep the length concise (under 15–20 seconds).
- Optimize for sound-off viewing (use captions).
- Maintain strict brand consistency.
FAQ: Making the Right Holiday Choice
1. Which format offers the fastest turnaround?
Info-graphics. They are quicker to produce and easier to revise, ideal for teams running tight holiday schedules.
2. Are motion graphics worth the extra cost?
Yes, if your campaign includes paid ads, product launches, or major promotions. Motion graphics generate stronger engagement. Using video on landing pages, for instance, can increase conversion rates by over 80% (Source: Unbounce).
3. Which format is better for clarity?
Infographics. They can boost user comprehension by up to 50% (Source: Visual Teaching Alliance), making complex information easy to digest quickly.
4. How can I use both formats in one campaign?
By combining them, use static assets for email/LinkedIn and animated assets for social ads. Simply using the word “video” in an email subject line can increase open rates by 19% (Source: HubSpot).
5. How should I decide which format to use for a specific message?
Ask the core questions: Is this data-heavy? (Infographic). Do I need emotion or movement? (Motion graphic). Will it run as a paid ad? (Motion graphic).
6. Which format is more shareable?
Both excel, but in different ways. Infographics share well on LinkedIn and newsletters (professional sharing), while motion graphics dominate Instagram and TikTok (feed sharing).
7. How can Info-Graphics help with production and execution?
Info-Graphics specializes in both advanced infographics and high-quality motion graphics. For complex projects, working with a specialized partner ensures crucial expertise and quality control. To understand the specific advantages of professional service, read our guide on the Top Benefits of Working with a Technical Design Agency.
Elevate Your Holiday Story
The decision isn’t between picking the “best” format—it’s about choosing the right tool for the right message. Infographics deliver clarity and speed; motion graphics deliver emotion and energy. When combined, they build campaigns that are memorable, adaptable, and optimized for maximum reach.
If you are ready to move past the strategic decision framework and start executing high-impact visuals for key products, learn how to leverage Professional Animated Infographics for Product Storytelling
If you want visuals that elevate your holiday message, Info-Graphics is here to help.


Leave A Comment